- Analytics
- Technical Analysis
Palladium Technical Analysis - Palladium Trading: 2017-10-31
The rise in palladium prices is much bigger than the growth of the world car market
Since the beginning of 2017, palladium prices have increased almost twofold and updated the 16-year high. Is there a possibility of a downward correction for palladium quotes?
More than 70% of palladium is used in the production of automotive catalysts, while the rest - in electronics, chemical industry, investment purposes, prosthetic dentistry and jewelry. Since the beginning of the year, its quotes increased by 76% and markedly exceeded the growth of car sales. According to LMC Automotive, the world car sales increased by only 2.7% in January - August 2017. Car sales in China grew by 5.7% in January - September. At the end of the year, sales declined in many countries, which may reduce the demand for palladium. Also note that there is an overall decline in the precious metals quotes in anticipation of a further Fed rate hike. According to U.S. Commodity Futures Trading Commission, the number of buy positions on gold on the COMEX has been declining for the 6th consecutive week. Most investment banks forecast an increase in palladium quotes by no more than 5% in the fourth quarter of 2017 and by about 10% next year. Correction is quite possible on the background of such modest expectations.
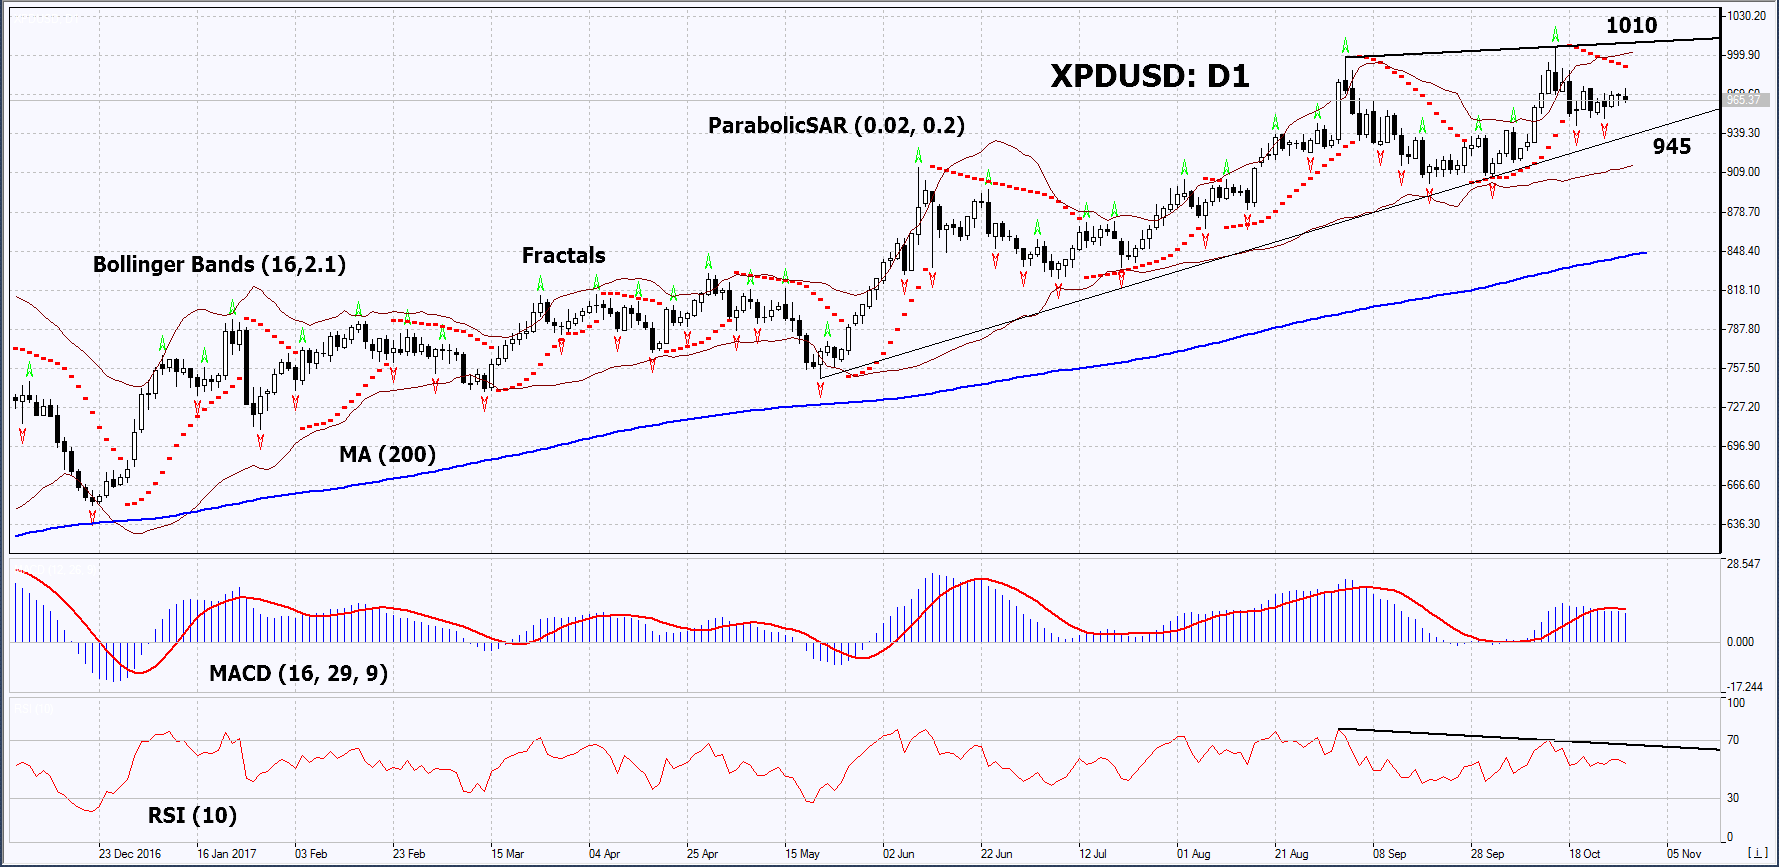
On the daily timeframe, XPDUSD: D1 remains in the rising trend, but its growth has slowed down and a number of technical analysis indicators have formed sell signals. A downward correction is possible in case the Fed has plans to increase the rate in the current year, as well as in case of slower rate growth of the world car market.
- The Parabolic indicator gives a bearish signal.
- The Bollinger bands have widened, which means higher volatility.
- The RSI indicator is above 50. It has formed a negative divergence.
- The MACD indicator gives a bearish signal.
The bullish momentum may develop in case XPDUSD drops below the two last fractal lows at 945. This level may serve as an entry point. The initial stop loss may be placed above all the last fractal high, the 16-year high, the upper Bollinger band and the Parabolic signal at 1010. After opening the pending order, we shall move the stop to the next fractal high following the Bollinger and Parabolic signals. Thus, we are changing the potential profit/loss to the breakeven point. More risk-averse traders may switch to the 4-hour chart after the trade and place there a stop loss moving it in the direction of the trade. If the price meets the stop level at 1010 without reaching the order at 945, we recommend cancelling the position: the market sustains internal changes that were not taken into account.
Summary of technical analysis
| Position | Sell |
| Sell stop | below 945 |
| Stop loss | above 1010 |
- Get Certificate

Note:
This overview has an informative and tutorial character and is published for free. All the data, included in the overview, are received from public sources, recognized as more or less reliable. Moreover, there is no guarantee that the indicated information is full and precise. Overviews are not updated. The whole information in each overview, including opinion, indicators, charts and anything else, is provided only for familiarization purposes and is not financial advice or а recommendation. The whole text and its any part, as well as the charts cannot be considered as an offer to make a deal with any asset. IFC Markets and its employees under any circumstances are not liable for any action taken by someone else during or after reading the overview.
